1. Overview
1.1 Purpose
The Deep Scholastic Assessment (DSA) is a concentration-level academic examination designed to measure students' genuine aptitude and potential in specific academic fields. DSA examinations test specialized academic topics typically taught at the sophomore, junior, or senior level of college programs, measuring not only current knowledge but also aptitude for learning advanced material.
1.2 Core Principles
- Aptitude-Based Assessment: Measures inherent ability and on-site learning capability
- Transparency: All attempts are reported with full context
- Fairness: Accounts for developmental timing while discouraging excessive retakes
- Theoretical Grounding: All scoring adjustments are derived from evidence-based academic growth models
2. Consolidated Score Formula
This section presents the complete scoring formula. Detailed explanations of each parameter follow in Section 3: Parameter Reference.
2.1 The Grand Formula
The Difficulty-Adjusted Score is the official DSA score reported to institutions. It is calculated through two stages:
Stage 1: Consolidated Score
(accounts for multiple attempts and timing)
Consolidated Score = MAX(Pathway₁, Pathway₂, Pathway₃)

Where:

Pathway₁ = Raw₁ + EffectiveBonus₁

Pathway₂ = Raw₁ + (Improvement₂ + EffectiveBonus₂) × 0.50

Pathway₃ = Raw₁ + (Improvement₃ + EffectiveBonus₃) × 0.10
Stage 2: Difficulty-Adjusted Score
(accounts for exam difficulty variation)
Difficulty-Adjusted Score = Consolidated Score + DI

Where:

DI = 90 − (R1 / R2) × 120

R1 = AP benchmark difficulty rating (calibrated, ≈ 3.0)
R2 = Specific DSA exam difficulty rating (must be ≥ 3.0)
See Section 8: Difficulty Calibration System for detailed explanation of R1, R2, and DI calculation.
2.2 Supporting Formulas
Effective Bonus
(adjusts Window Bonus based on headroom)
EffectiveBonus = WindowBonus × MIN(Headroom / 36, 1)

Where: Headroom = 120 − RawScore
Improvement
(measures gain from first attempt)
Improvement₂ = MAX(Raw₂ − Raw₁, 0)
Improvement₃ = MAX(Raw₃ − Raw₁, 0)
2.3 Parameter Glossary
| Parameter | Definition | Reference |
|---|---|---|
| Raw Score | Performance score (0-120) on a single examination attempt | — |
| Testing Window | When the attempt was taken (Y-4 H1 through Y-1 H1) | Section 3.1 |
| Attempt Number | Sequential count of attempts (1st, 2nd, or 3rd) | Section 3.2 |
| Window Bonus | Base bonus for early testing (+0 to +15.6) | Section 3.3 |
| Effective Bonus | Window Bonus adjusted for headroom | Section 3.4 |
| Headroom | Growth potential remaining (120 − Raw Score) | Section 3.4 |
| Credit Rate | Weight applied to improvement (100%, 50%, or 10%) | Section 3.5 |
| Improvement | Raw score gain from 1st attempt to subsequent attempt | — |
| 36 (Divisor) | Total growth potential from secondary education through college | Section 6 |
| R1 | AP benchmark difficulty rating (calibrated from real AP questions) | Section 8 |
| R2 | Specific DSA exam difficulty rating | Section 8 |
| DI | Difficulty Index: score adjustment for exam difficulty | Section 8 |
2.4 Calculation Rules
| Rule | Specification |
|---|---|
| Pathway Selection | System automatically selects the pathway yielding the highest score |
| Negative Improvement | If subsequent attempt scores lower than first, Improvement = 0 |
| Effective Bonus | Calculated separately for each attempt based on that attempt's raw score and window |
| Precision | Calculated and reported to one decimal place |
| Hard Cap | Consolidated Score cannot exceed 120 |
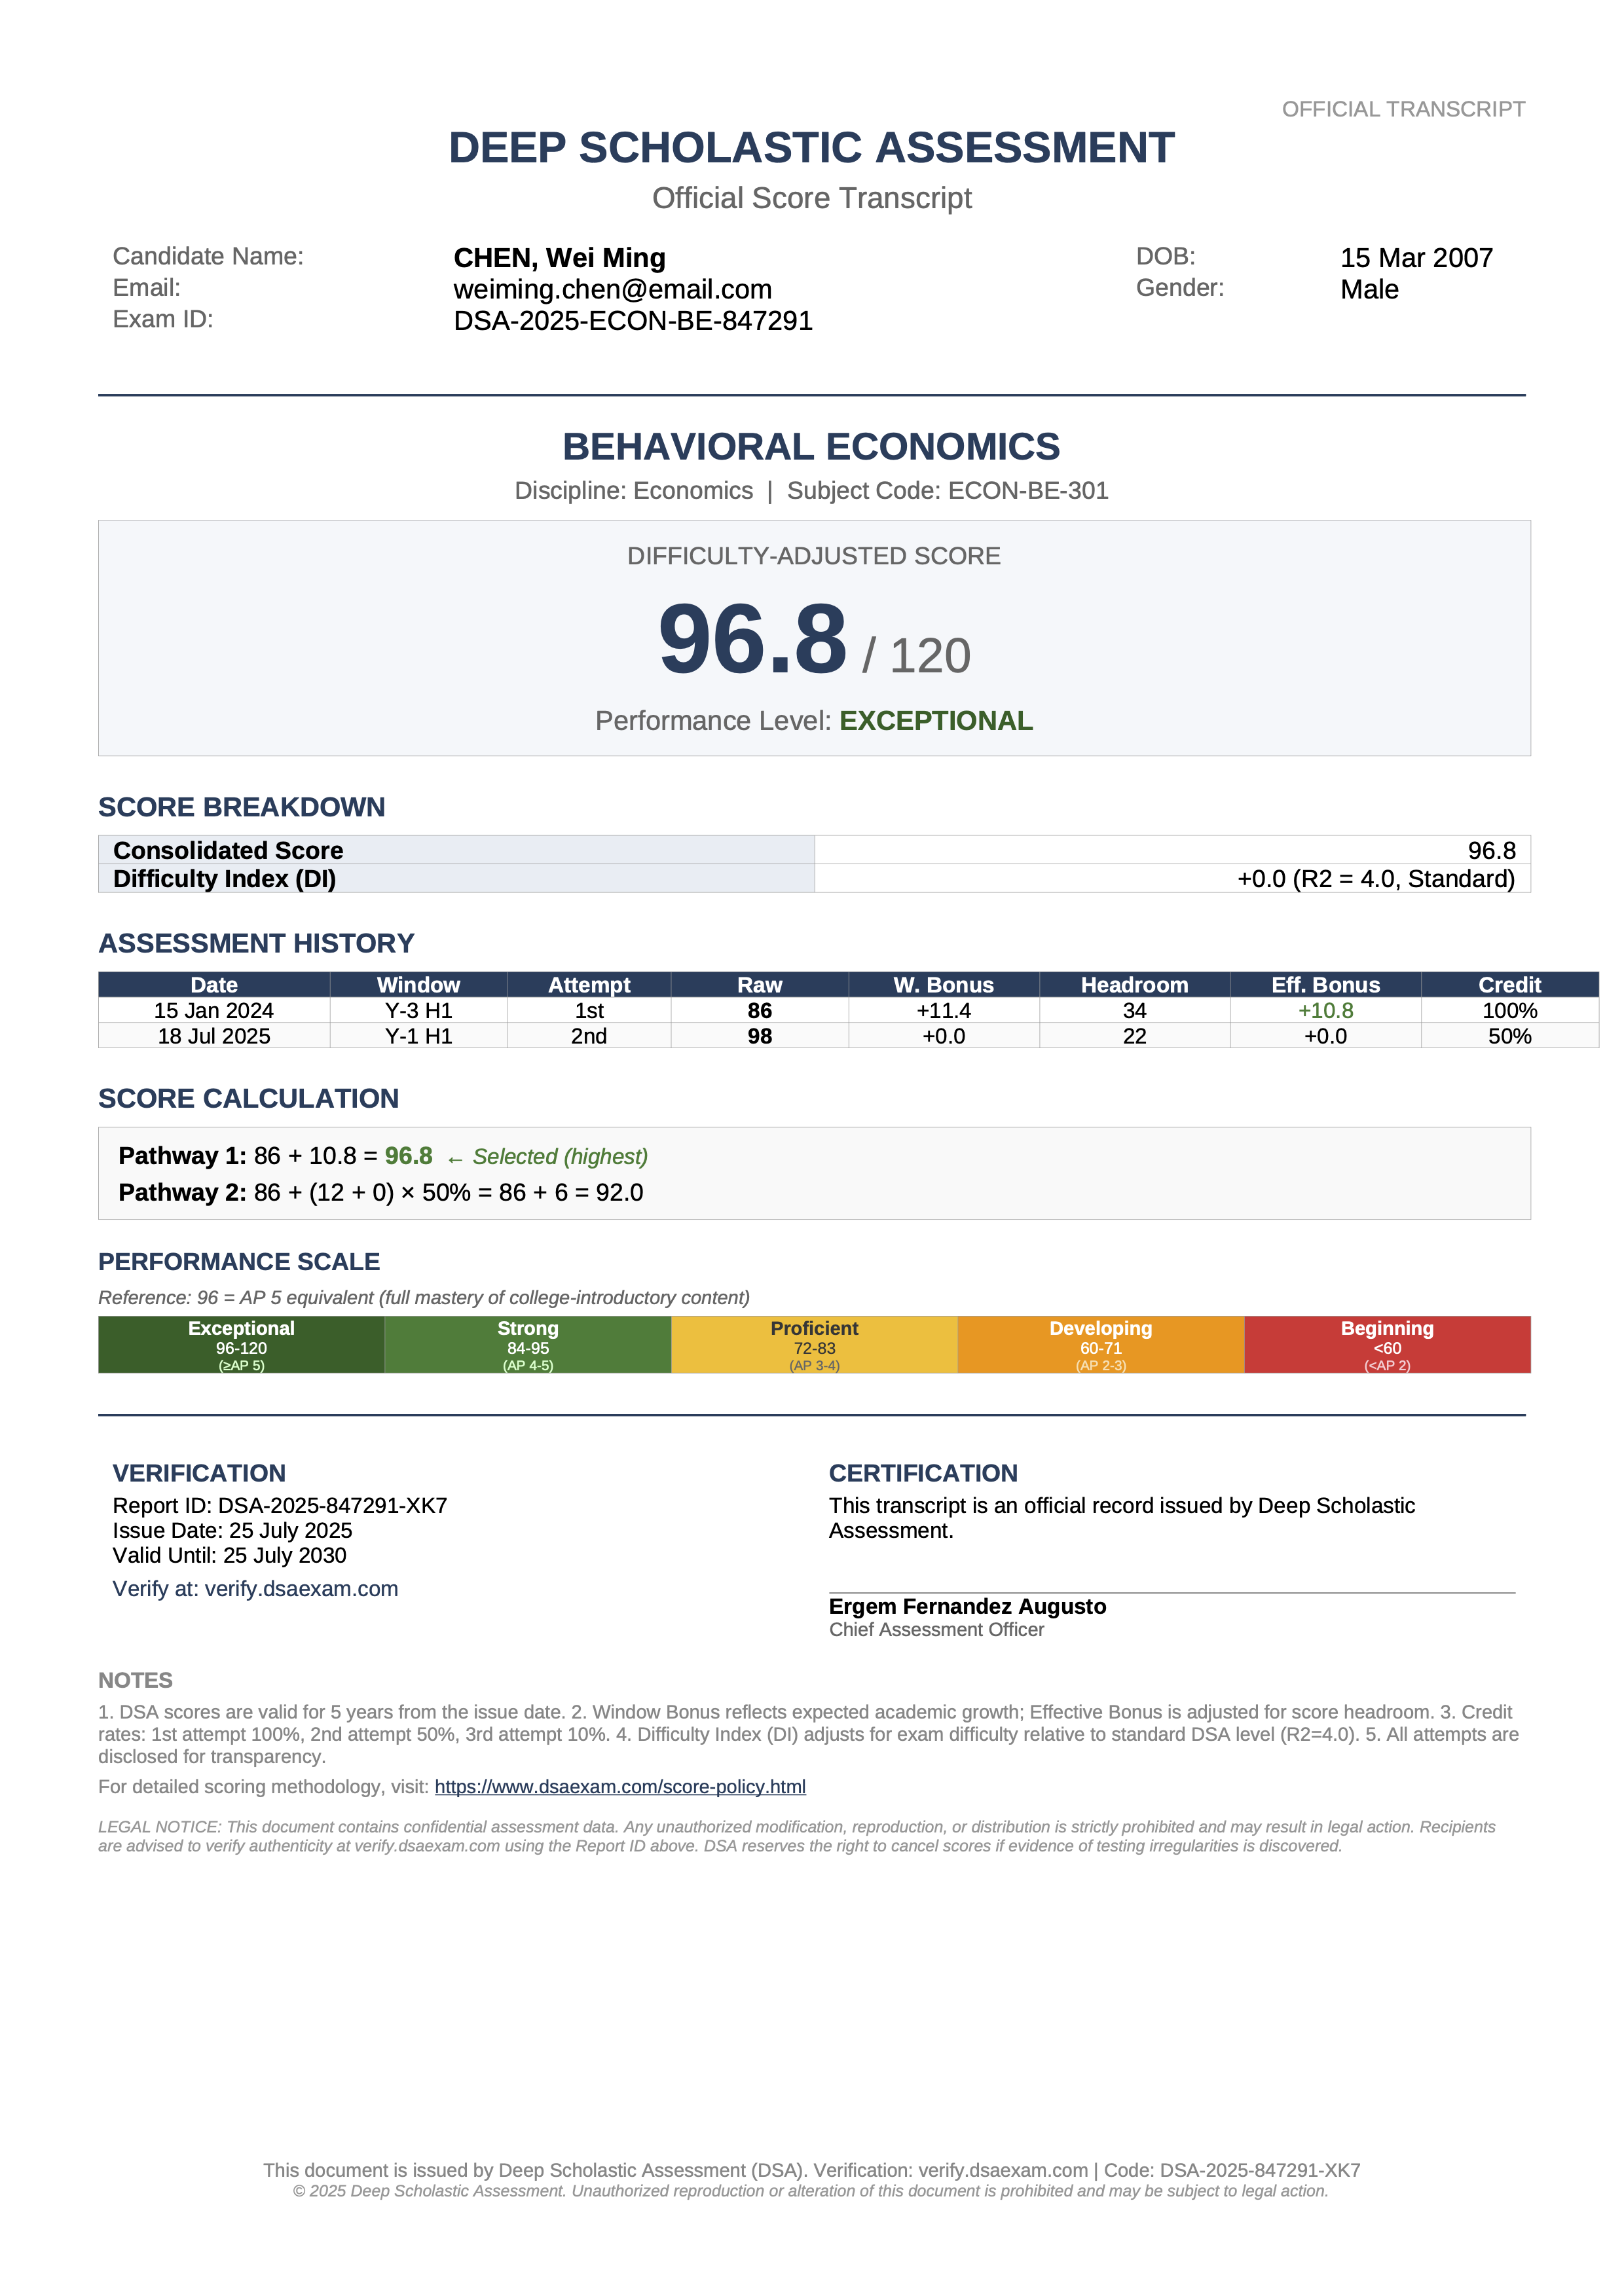
2.5 Quick Calculation Example
Student takes two attempts:
- Y-3 H1: Raw Score 86
- Y-1 H1: Raw Score 98
Step 1: Calculate Effective Bonuses
- Attempt 1: WindowBonus = 11.4, Headroom = 34 → EffectiveBonus₁ = 11.4 × (34/36) = 10.77
- Attempt 2: WindowBonus = 0, Headroom = 22 → EffectiveBonus₂ = 0
Step 2: Calculate Pathways
- Pathway₁ = 86 + 10.77 = 96.77
- Pathway₂ = 86 + (12 + 0) × 0.50 = 86 + 6 = 92
Step 3: Select Maximum
Consolidated Score = MAX(96.77, 92) = 96.77
3. Parameter Reference
3.1 Testing Windows
3.1.1 Universal Grade Reference System
DSA uses a universal grade reference system to accommodate different secondary education structures worldwide. Years are referenced relative to collegiate (university/higher education) entry:
| DSA Reference | Definition | Equivalent Examples |
|---|---|---|
| Y-4 | 4th year before college entry | US 9th grade, UK Year 10, East Asia Secondary Year 1 |
| Y-3 | 3rd year before college entry | US 10th grade, UK Year 11, East Asia Secondary Year 2 |
| Y-2 | 2nd year before college entry | US 11th grade, UK Year 12 / Lower Sixth, East Asia Secondary Year 3 |
| Y-1 | Final year before college entry | US 12th grade, UK Year 13 / Upper Sixth, East Asia Secondary Year 3+ |
Note: Students should identify their year level based on how many years remain before they would enter collegiate/university education.
3.1.2 Semi-Annual Testing Windows
DSA operates on a semi-annual testing schedule with two windows per academic year:
| Window | Period | Registration Opens | Registration Closes |
|---|---|---|---|
| First Half (H1) | [To Be Determined] | [TBD] | [TBD] |
| Second Half (H2) | [To Be Determined] | [TBD] | [TBD] |
3.1.3 Available Testing Windows
| Testing Window | DSA Reference | Description |
|---|---|---|
| Y-4 H1 | 4th year before college, First Half | Entry to secondary education |
| Y-4 H2 | 4th year before college, Second Half | Completing first year |
| Y-3 H1 | 3rd year before college, First Half | Beginning second year |
| Y-3 H2 | 3rd year before college, Second Half | Completing second year |
| Y-2 H1 | 2nd year before college, First Half | Beginning penultimate year |
| Y-2 H2 | 2nd year before college, Second Half | Completing penultimate year |
| Y-1 H1 | Final year before college, First Half | Final testing opportunity |
The Y-1 H2 window is not offered, as results would not be available in time for admissions decisions.
3.2 Attempt Policy
3.2.1 Attempt Limits
| Rule | Specification |
|---|---|
| Maximum Lifetime Attempts | 3 per subject |
| Attempts per Testing Window | 1 per subject |
| Minimum Gap Between Attempts | One testing window (approximately 6 months) |
3.2.2 Attempt Counting
- Attempts are counted chronologically regardless of gaps between testing windows
- A student who tests in Y-4 H1 and Y-1 H1 has taken their 1st and 2nd attempts, respectively
- Skipped windows do not count as attempts
3.3 Window Bonus
The Window Bonus rewards early demonstration of aptitude by providing additional points based on when the examination was taken.
3.3.1 Window Bonus Values
| Testing Window | Window Bonus |
|---|---|
| Y-4 H1 | +15.6 |
| Y-4 H2 | +13.8 |
| Y-3 H1 | +11.4 |
| Y-3 H2 | +8.4 |
| Y-2 H1 | +4.8 |
| Y-2 H2 | +1.2 |
| Y-1 H1 | 0 |
3.3.2 Rationale
The Window Bonus values represent the cumulative expected academic growth from each testing window to Y-1 H1. Earlier testing demonstrates aptitude at a younger developmental stage, indicating greater future potential. See Section 6: Theoretical Foundation for the complete growth model.
3.4 Effective Bonus
The Effective Bonus adjusts the Window Bonus based on the student's headroom — the gap between their raw score and the maximum score of 120.
3.4.1 Formula
Effective Bonus = Window Bonus × MIN(Headroom / 36, 1)

Where: Headroom = 120 − Raw Score
3.4.2 Interpretation
| Raw Score | Headroom | Multiplier | % of Window Bonus Applied |
|---|---|---|---|
| ≤84 | ≥36 | 1.0 | 100% (full bonus) |
| 90 | 30 | 0.833 | 83.3% |
| 96 | 24 | 0.667 | 66.7% |
| 102 | 18 | 0.5 | 50% |
| 108 | 12 | 0.333 | 33.3% |
| 114 | 6 | 0.167 | 16.7% |
3.4.3 Rationale
This formula models the ceiling effect: a student scoring 114 cannot realistically grow another 15.6 points, because their potential is capped at 120. The headroom-based calculation ensures that:
- Students with raw scores ≤84 receive the full Window Bonus
- Students with raw scores >84 receive proportionally reduced bonuses
- High scorers are still rewarded for early testing, but in realistic proportion to their growth potential
3.5 Attempt Credit Rates
When a student takes multiple attempts, subsequent attempts receive partial credit for improvement.
3.5.1 Credit Rate Values
| Attempt | Credit Rate | Application |
|---|---|---|
| 1st Attempt | 100% (baseline) | Forms the base of all pathway calculations |
| 2nd Attempt | 50% | Improvement + Effective Bonus multiplied by 0.50 |
| 3rd Attempt | 10% | Improvement + Effective Bonus multiplied by 0.10 |
3.5.2 Rationale
- 1st attempt (100%): The purest aptitude signal, uncontaminated by prior test exposure
- 2nd attempt (50%): Acknowledges that bad days happen; reasonable retry opportunity
- 3rd attempt (10%): Minimal credit; reliance on repetition rather than aptitude
4. Score Reporting
4.1 Official Score Report Contents
Each DSA Official Score Report includes:
- Difficulty-Adjusted Score — The final official score for admissions evaluation
- Consolidated Score — Score before difficulty adjustment
- Difficulty Index (DI) — Adjustment applied based on exam difficulty
- Complete Attempt History — All attempts with dates, year levels, raw scores, and effective bonuses
- Calculation Transparency — Full breakdown showing how scores were derived
4.2 Score Report Format
4.3 Score Availability
- Scores are available within one week of examination completion
- Official Score Reports can be sent to institutions upon student request
- Students have unlimited access to their own score reports via the DSA portal
4.4 Pre-Examination Difficulty Disclosure
The Difficulty Index (DI) for each examination is disclosed to students before the examination. This allows students to understand the test's difficulty level in advance and set appropriate expectations for their adjusted score. See Section 8.6.5 for details.
5. Worked Examples
Example 1: Single Attempt — Moderate Score, Full Bonus
Scenario: A Y-3 H1 student takes Behavioral Economics and scores 84.
| Parameter | Value | Calculation |
|---|---|---|
| Raw Score | 84 | — |
| Headroom | 36 | 120 − 84 |
| Window Bonus | +11.4 | Y-3 H1 value |
| Effective Bonus | +11.4 | 11.4 × MIN(36/36, 1) = 11.4 × 1 |
| Pathway 1 | 95.4 | 84 + 11.4 |
Consolidated Score: 95.4
Example 2: Single Attempt — High Score, Reduced Bonus
Scenario: A Y-4 H1 student scores 106 on Political Economics.
| Parameter | Value | Calculation |
|---|---|---|
| Raw Score | 106 | — |
| Headroom | 14 | 120 − 106 |
| Window Bonus | +15.6 | Y-4 H1 value |
| Effective Bonus | +6.07 | 15.6 × MIN(14/36, 1) = 15.6 × 0.389 |
| Pathway 1 | 112.07 | 106 + 6.07 |
Consolidated Score: 112.07
The student's high raw score leaves only 14 points of headroom, so the bonus is proportionally reduced.
Example 3: Two Attempts — Improvement Pathway Wins
Scenario: Student tests in Y-2 H1 (score 82), retakes in Y-1 H1 (score 98).
Effective Bonuses:
| Attempt | Raw | Headroom | Window Bonus | Effective Bonus |
|---|---|---|---|---|
| 1st (Y-2 H1) | 82 | 38 | +4.8 | +4.8 (full) |
| 2nd (Y-1 H1) | 98 | 22 | 0 | 0 |
Pathway Calculations:
| Pathway | Calculation | Value |
|---|---|---|
| Pathway 1 | 82 + 4.8 | 86.8 |
| Pathway 2 | 82 + (16 + 0) × 50% = 82 + 8 | 90 |
Consolidated Score: 90
The 16-point improvement at 50% credit exceeds the 1st attempt's effective bonus.
Example 4: Three Attempts — Grinding Pattern
Scenario: Student tests in Y-3 H2 (score 72), Y-2 H1 (score 86), and Y-1 H1 (score 102).
Effective Bonuses:
| Attempt | Raw | Headroom | Window Bonus | Effective Bonus |
|---|---|---|---|---|
| 1st (Y-3 H2) | 72 | 48 | +8.4 | +8.4 (full) |
| 2nd (Y-2 H1) | 86 | 34 | +4.8 | +4.53 |
| 3rd (Y-1 H1) | 102 | 18 | 0 | 0 |
Pathway Calculations:
| Pathway | Calculation | Value |
|---|---|---|
| Pathway 1 | 72 + 8.4 | 80.4 |
| Pathway 2 | 72 + (14 + 4.53) × 50% = 72 + 9.27 | 81.27 |
| Pathway 3 | 72 + (30 + 0) × 10% = 72 + 3 | 75 |
Consolidated Score: 81.27
Despite achieving a raw score of 102 on the 3rd attempt, the Consolidated Score is only 81.27. The 10% credit rate heavily discounts late improvement.
6. Theoretical Foundation
This section explains the academic growth model underlying the scoring system. Understanding this section is optional but provides insight into why specific values were chosen.
6.1 The Full Potential Framework
DSA concentration subjects assess content typically taught at the sophomore, junior, or senior level of college. Full Potential is defined as the level of mastery a student would achieve upon completing their college major in the relevant field.
6.2 Total Growth Model
Total Growth Potential = Secondary Education Growth + College Growth
         (36 points)           (15.6 points)            (20.4 points)
This establishes 36 points as the divisor in the Effective Bonus calculation.
6.3 Secondary Education Growth (15.6 Points)
Growth is not linear — it accelerates during secondary education, with the penultimate year (Y-2) representing the peak learning period.
| Semester Transition | Growth Points | Rationale |
|---|---|---|
| Y-4 H1 → Y-4 H2 | +1.8 | Building foundational academic skills |
| Y-4 H2 → Y-3 H1 | +2.4 | Expanding academic exposure |
| Y-3 H1 → Y-3 H2 | +3.0 | Pre-peak buildup, advanced coursework begins |
| Y-3 H2 → Y-2 H1 | +3.6 | Peak begins — heavy advanced course load |
| Y-2 H1 → Y-2 H2 | +3.6 | Peak continues — maximum academic intensity |
| Y-2 H2 → Y-1 H1 | +1.2 | Consolidation phase |
Total: 15.6 points
6.4 College Growth (20.4 Points)
| College Year | Growth Points | Rationale |
|---|---|---|
| Freshman | +3.6 | General education, introductory major courses |
| Sophomore | +4.8 | Core major courses, foundational concentration |
| Junior | +7.2 | Peak — deep concentration courses, specialization |
| Senior | +4.8 | Advanced work, thesis/capstone |
Total: 20.4 points
6.5 Window Bonus Derivation
Window Bonuses represent cumulative expected growth from each window to Y-1 H1:
| Testing Window | Calculation | Window Bonus |
|---|---|---|
| Y-4 H1 | 1.8 + 2.4 + 3.0 + 3.6 + 3.6 + 1.2 | +15.6 |
| Y-4 H2 | 2.4 + 3.0 + 3.6 + 3.6 + 1.2 | +13.8 |
| Y-3 H1 | 3.0 + 3.6 + 3.6 + 1.2 | +11.4 |
| Y-3 H2 | 3.6 + 3.6 + 1.2 | +8.4 |
| Y-2 H1 | 3.6 + 1.2 | +4.8 |
| Y-2 H2 | 1.2 | +1.2 |
| Y-1 H1 | 0 | 0 |
6.6 Why 36 as the Divisor
The divisor ensures that:
- Students with headroom ≥36 receive full bonuses (room to grow the expected amount)
- Students with less headroom receive proportionally reduced bonuses
- The system models diminishing returns as students approach mastery
7. Policy Rationale
7.1 Why Window Bonuses?
- Cognitive development is real: A 14-year-old and an 18-year-old have measurably different reasoning capabilities
- Academic exposure accumulates: Students gain foundational knowledge throughout secondary education
- Earlier demonstration indicates potential: A younger student showing aptitude has greater future potential
- Timing matters for interpretation: Universities benefit from knowing when aptitude was demonstrated
7.2 Why the Headroom-Based Effective Bonus?
- Growth potential has limits: A student scoring 114 cannot grow another 15.6 points
- Proportionality is fair: Students receive bonus credit proportional to realistic growth potential
- No arbitrary caps: The formula provides a principled, transparent adjustment
- High performers are still rewarded: Early testing still provides benefit, proportionally
7.3 Why Discount Later Attempts?
- First attempts carry the most weight: The purest aptitude signal
- One retry is reasonable: Bad days happen
- Third attempts provide minimal benefit: Reliance on repetition rather than aptitude
7.4 Why Report All Attempts?
- Complete information: Admissions officers can evaluate the full pattern
- Discourages casual attempts: Students cannot hide poor performances
- Rewards deliberate preparation: Incentivizes taking DSA seriously from the first attempt
7.5 Why Semi-Annual Testing?
- Alignment with academic cycles: Testing windows correspond to natural milestones
- Sufficient gap for growth: Approximately six months between attempts
- Prevention of rapid retakes: Students cannot immediately retry after poor performance
8. Difficulty Calibration System
8.1 Purpose and Design Principles
8.1.1 The Challenge
Different DSA concentration examinations have inherently different difficulty levels. A student scoring 85 on an advanced Econometrics exam may demonstrate greater aptitude than a student scoring 95 on an introductory-level exam. The Difficulty Calibration System ensures fair comparison across all DSA examinations.
8.1.2 Design Principles
| Principle | Implementation |
|---|---|
| Objective measurement | AI-based rating using standardized rubric |
| Bottom-up calculation | Question-by-question evaluation, then aggregation |
| Empirical calibration | Benchmark established from 500-1000 real AP questions per major |
| Per-major benchmark | Each academic major has its own AP benchmark (e.g., AP Economics → all Economics concentrations) |
| Controlled scale | Prevents difficulty index inflation |
| Minimum difficulty floor | All DSA exams must be at least AP-level difficulty (R2 ≥ 3.0) |
8.1.3 Relationship to AP Benchmark
The system is anchored to AP (Advanced Placement) examinations as a globally recognized standard:
| Level | Description | Expected Score for AP-Mastery Student |
|---|---|---|
| AP Level | College-introductory | 120/120 (full score) |
| Standard DSA | Concentration level (⅓ harder than AP) | 90/120 (75%) |
This establishes that a student who has fully mastered AP-level content would score approximately 90/120 (75%) on a standard DSA concentration exam, with the remaining 25% testing aptitude, on-site learning ability, and potential for advanced study.
8.2 Benchmark Ruler
The Benchmark Ruler provides reference points for difficulty calibration. It is used for validation only, not for direct question rating.
| Score | Level | Description |
|---|---|---|
| 1 | High school basic | Fundamental high school curriculum |
| 2 | High school advanced | Advanced high school / pre-college |
| 3 | AP / College-introductory | Anchor point (R1 ≈ 3.0) |
| 4 | Standard DSA / Concentration | Target for DSA exams |
| 5 | Advanced concentration | Upper bound for difficult exams |
Validation Rule: When rating 500-1000 actual AP questions using the rubric, the average should be approximately 3.0. This confirms the scale is properly anchored.
8.3 Difficulty Rating Rubric
Each question is rated using a 4-dimension rubric, with each dimension calibrated to the Benchmark Ruler where 3 = AP level and 4 = Standard DSA level.
8.3.1 Material Component
The Material Component accounts for study materials associated with the question.
Part A: Material Difficulty
| Score | Description | Calibration |
|---|---|---|
| 1 | Simple descriptive text, casual reading level | — |
| 2 | Standard textbook explanation | — |
| 3 | College-introductory level content | = AP |
| 4 | Academic paper excerpt, dense concepts | = DSA |
| 5 | Research paper, highly technical content | = Hard |
Part B: On-Site Adjustment
| Condition | Adjustment |
|---|---|
| Pre-given materials (can prepare in advance) | +0 |
| On-site materials (must read during exam) | +0.5 |
Material Score Formula:
Material Score = Material Difficulty + On-Site Adjustment
8.3.2 Question Dimensions
D1: Knowledge Position — Fundamental vs. specialized knowledge
| Score | Description | Calibration |
|---|---|---|
| 1 | General knowledge, not subject-specific | — |
| 2 | Foundational, intro-level concepts | — |
| 3 | Core fundamentals of the field | = AP |
| 4 | Specialized concentration topics | = DSA |
| 5 | Highly specialized, niche areas | = Hard |
D2: Cognitive Pattern — Type of thinking required (includes reasoning, calculation, novelty)
| Score | Description | Calibration |
|---|---|---|
| 1 | Recall / memorize definition | — |
| 2 | Recognize, explain, simple calculation | — |
| 3 | Apply concept, standard reasoning, moderate calculation | = AP |
| 4 | Multi-step reasoning, complex calculation, novel framing | = DSA |
| 5 | Complex reasoning, heavy calculation, novel problem structure | = Hard |
D3: Integration Demand — Prerequisite breadth and cross-concept synthesis
| Score | Description | Calibration |
|---|---|---|
| 1 | Single concept, self-contained | — |
| 2 | 1-2 concepts, minimal integration | — |
| 3 | 2-3 concepts, standard integration | = AP |
| 4 | Multiple concepts, cross-topic synthesis | = DSA |
| 5 | Extensive cross-domain synthesis | = Hard |
8.3.3 Question Rating Formula
Question Score = (D1 + D2 + D3) / 3

Question Rating = (Material Score + Question Score) / 2
8.4 Calibration Process
See the full policy document for detailed calibration process including AP benchmark calibration and per-exam DSA rating.
8.5 Difficulty Index Calculation
8.5.1 Formula
DI = 90 − (R1 / R2) × 120

Where:
  R1 = AP benchmark rating (from calibration, ≈ 3.0)
  R2 = Specific DSA exam rating (from per-exam rating)
8.5.2 Interpretation
The formula derives from the anchor: An AP-mastery student scores 90/120 on standard DSA.
- Expected score for AP-mastery student = (R1 / R2) × 120
- DI = 90 − Expected = compensation needed to normalize to standard
| Exam Difficulty | R2 (if R1=3.0) | Expected Score | DI | Meaning |
|---|---|---|---|---|
| Easier than standard | 3.5 | 102.9 | -12.9 | Subtract ~13 points |
| Standard DSA | 4.0 | 90 | 0 | No adjustment |
| Harder than standard | 4.5 | 80 | +10 | Add 10 points |
| Very hard | 5.0 | 72 | +18 | Add 18 points |
8.6 Difficulty-Adjusted Score
8.6.1 Final Formula
Difficulty-Adjusted Score = Consolidated Score + DI
8.6.2 Calculation Rules
| Rule | Specification |
|---|---|
| Hard Cap | Difficulty-Adjusted Score cannot exceed 120 |
| Floor | Difficulty-Adjusted Score has no minimum floor |
| Precision | DI calculated and applied to one decimal place |
| Negative DI | Applied as subtraction (easier exams reduce score) |
| Positive DI | Applied as addition (harder exams increase score) |
8.6.3 Pre-Examination Disclosure
Policy: The Difficulty Index (DI) for each examination is calculated and disclosed to students before the examination begins.
Purpose:
- Students understand the test's difficulty level in advance
- Students can set appropriate expectations for their adjusted score
- No surprises after receiving scores
- Transparency in the scoring process
Timing: DI is disclosed at registration confirmation and again at examination check-in.
9. Appendices
Appendix A: Quick Reference Tables
A.1 Window Bonus Values
| Window | Window Bonus |
|---|---|
| Y-4 H1 | +15.6 |
| Y-4 H2 | +13.8 |
| Y-3 H1 | +11.4 |
| Y-3 H2 | +8.4 |
| Y-2 H1 | +4.8 |
| Y-2 H2 | +1.2 |
| Y-1 H1 | 0 |
A.2 Attempt Credit Rates
| Attempt | Credit Rate |
|---|---|
| 1st | 100% (baseline) |
| 2nd | 50% |
| 3rd | 10% |
A.3 Effective Bonus Quick Reference
| Raw Score | Headroom | Multiplier | Y-4 H1 Eff. Bonus | Y-3 H1 Eff. Bonus |
|---|---|---|---|---|
| 72 | 48 | 1.0 | +15.6 | +11.4 |
| 84 | 36 | 1.0 | +15.6 | +11.4 |
| 90 | 30 | 0.833 | +13.0 | +9.5 |
| 96 | 24 | 0.667 | +10.4 | +7.6 |
| 102 | 18 | 0.5 | +7.8 | +5.7 |
| 108 | 12 | 0.333 | +5.2 | +3.8 |
| 114 | 6 | 0.167 | +2.6 | +1.9 |
Document Control
| Version | Date | Changes |
|---|---|---|
| 1.0 | December 2025 | Initial release |
| 1.1 | December 2025 | Added growth model; headroom-based effective bonus |
| 1.2 | December 2025 | Universal grade reference (Y-4 to Y-1); H1/H2 windows |
| 2.0 | December 2025 | Restructured to "answer first" format; formula upfront with parameter reference sections |
| 2.1 | December 2025 | Changed to 120-point scale; all values scaled proportionally (×1.2) |
| 2.2 | December 2025 | Added Difficulty Calibration System (Section 8); AI-based difficulty rating with AP benchmark; Difficulty-Adjusted Score as final output |
| 2.3 | December 2025 | Added edge case documentation; pre-examination DI disclosure policy; per-major AP calibration with 500-1000 questions; universal AP material score |